
Introduction
You don’t need to be an accountant to run a successful business.
But you do need to understand your numbers.
Too many business owners don’t really look at their financial statements until tax season, they’re applying for financing, or something feels wrong with the business.
By then, the numbers may simply be confirming a problem that started months earlier.
Your accounting reports should do more than tell you what happened last year. When reviewed consistently, they can help you understand what’s happening right now.
Is revenue growing?
Are expenses growing faster?
Are customers paying you?
Are you generating cash?
Can you afford your next hire?
Are you actually making the profit you thought you were?
At Lucia & Co. CPAs, we believe financial reporting is most useful when business owners can understand the story behind the numbers.
Here are five reports worth reviewing every month.
What You’ll Learn
- The five financial reports business owners should review regularly
- What a Profit & Loss Statement tells you
- How to read a Balance Sheet
- Why profit and cash flow aren’t the same thing
- How Accounts Receivable Aging can reveal collection problems
- Why comparing your budget to actual results matters
- What questions to ask when reviewing each report
1. Profit & Loss Statement
If you’re going to review only one financial report each month, your Profit & Loss Statement, or P&L, is a good place to start.
It may also be called an Income Statement.
The P&L summarizes your revenue and expenses over a specific period and ultimately tells you whether the business generated a profit or loss.
Example Profit & Loss Statement
For the Month Ended July 31
| Category | Current Month | Year to Date |
| Revenue | $245,000 | $1,715,000 |
| Cost of Goods Sold | $87,000 | $609,000 |
| Gross Profit | $158,000 | $1,106,000 |
| Salaries & Wages | $36,000 | $252,000 |
| Rent | $7,500 | $52,500 |
| Marketing | $5,200 | $36,400 |
| Utilities | $2,800 | $20,100 |
| Other Expenses | $6,300 | $44,100 |
| Total Operating Expenses | $57,800 | $405,100 |
| Net Profit | $100,200 | $700,900 |
Example for educational purposes only.
What Should You Look for on a P&L?
Don’t just jump to the bottom and see whether the number is positive.
Ask questions.
Is Revenue Increasing or Decreasing?
Compare revenue with:
- Last month
- The same month last year
- Your budget
- Your annual goal
One unusually strong or weak month doesn’t necessarily indicate a trend.
Several months moving in the same direction deserves attention.
What Is Happening to Gross Profit?
Increasing sales doesn’t automatically mean increasing profits.
If your cost of delivering your product or service rises faster than revenue, you can become busier while becoming less profitable.
That’s why gross profit and gross margin deserve attention.
Which Expenses Are Growing?
Look for significant changes.
Maybe payroll increased.
Maybe insurance jumped.
Maybe advertising expenses increased.
The question isn’t automatically:
“How do we cut this expense?”
Ask:
“Why did this expense change, and are we getting an appropriate return from it?”
Are We Actually Profitable?
Revenue gets attention.
Profit builds sustainable businesses.
A company doing $5 million in sales and losing money has a much bigger problem than a $2 million company generating healthy, predictable profits.

2. Balance Sheet
Your P&L tells you what happened over a period of time.
Your Balance Sheet tells you where the business stands at a particular point in time.
It summarizes three major categories:
Assets = What the business owns
Liabilities = What the business owes
Equity = The owner’s financial interest in the business
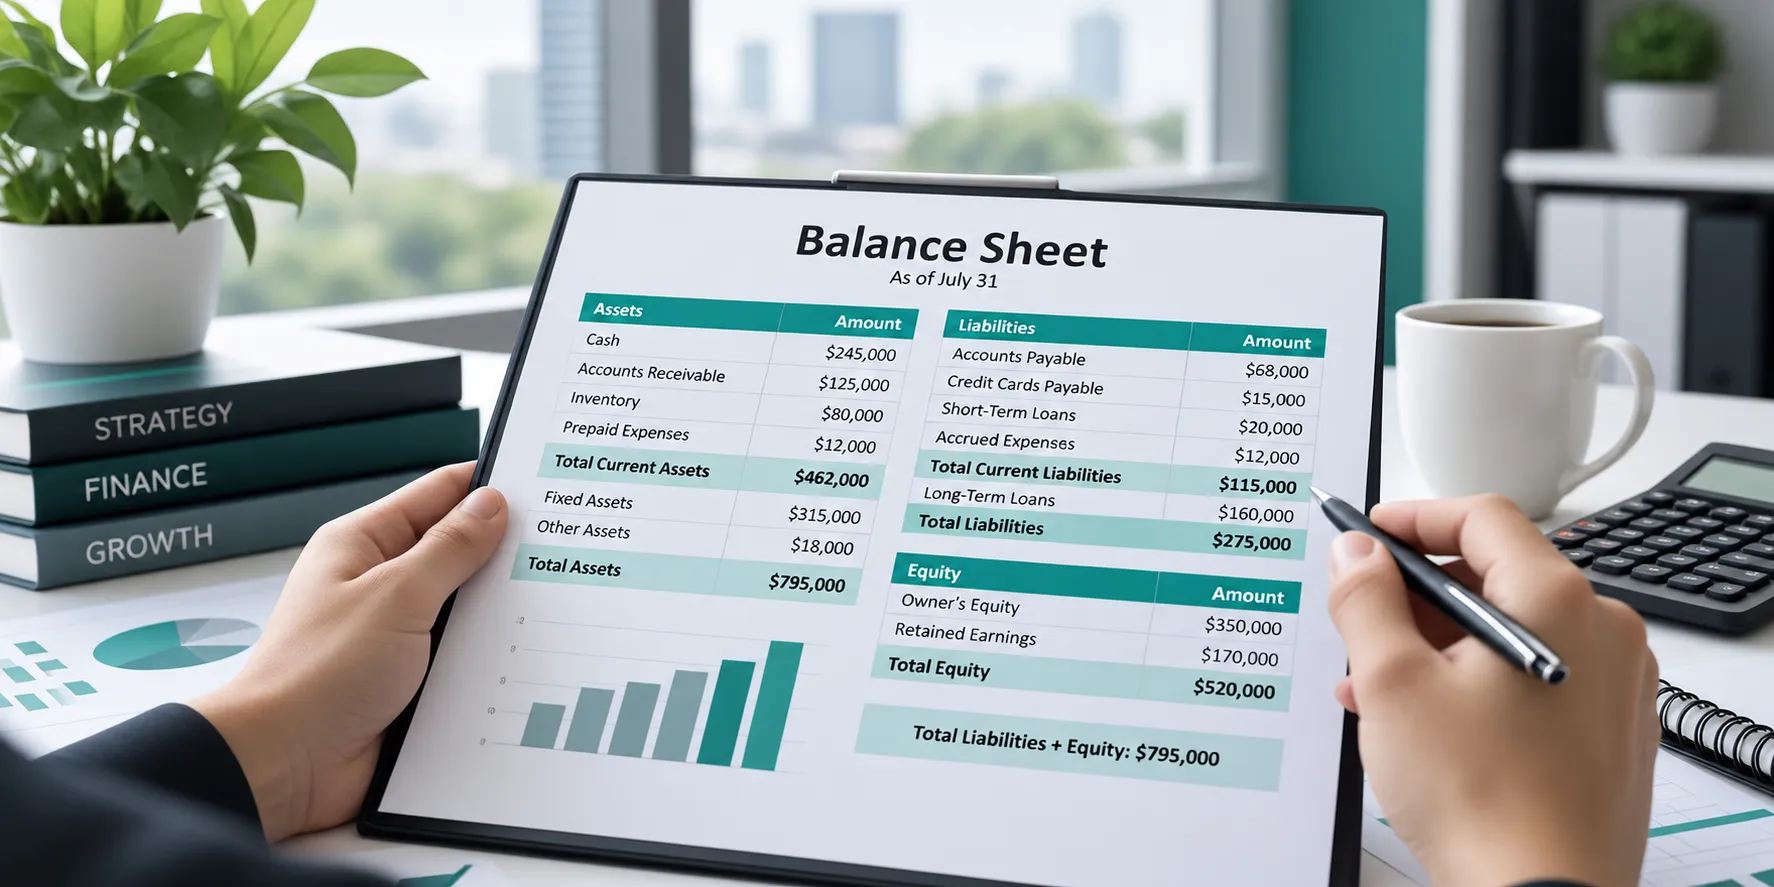
Example Balance Sheet
As of July 31
| Assets | Amount |
| Cash | $245,000 |
| Accounts Receivable | $125,000 |
| Inventory | $80,000 |
| Prepaid Expenses | $12,000 |
| Total Current Assets | $462,000 |
| Fixed Assets | $315,000 |
| Other Assets | $18,000 |
| Total Assets | $795,000 |
| Liabilities | Amount |
| Accounts Payable | $68,000 |
| Credit Cards Payable | $15,000 |
| Short-Term Loans | $20,000 |
| Accrued Expenses | $12,000 |
| Total Current Liabilities | $115,000 |
| Long-Term Loans | $160,000 |
| Total Liabilities | $275,000 |
| Equity | Amount |
| Owner’s Equity | $350,000 |
| Retained Earnings | $170,000 |
| Total Equity | $520,000 |
Total Liabilities + Equity: $795,000
Example for educational purposes only.
What Should You Look for on a Balance Sheet?
Start with cash.
Then look at receivables, debt, current liabilities, and overall equity.
Ask:
Do we have enough liquid assets to meet upcoming obligations?
Is debt increasing or decreasing?
Are accounts receivable growing because sales are growing—or because customers aren’t paying?
Is the financial position of the business strengthening over time?
The Balance Sheet becomes particularly useful when compared month to month rather than viewed in isolation.
3. Cash Flow Statement
Here’s one of the most important concepts for business owners:
Profit does not necessarily equal cash.
Your P&L might show a profitable month while your bank account tells a completely different story.
Why?
Because accounting recognizes certain transactions differently from the actual movement of cash.
You might make a large sale today but not collect the money for 60 days.
You might purchase equipment.
You might make a large loan payment.
You might build inventory.
That’s why the Cash Flow Statement matters.
Example Cash Flow Statement
For the Month Ended July 31
| Category | Amount |
| Operating Activities | |
| Cash Received from Customers | $265,000 |
| Cash Paid to Vendors & Employees | ($185,000) |
| Other Operating Cash | ($15,000) |
| Net Cash from Operating Activities | $65,000 |
| Investing Activities | |
| Equipment Purchases | ($22,000) |
| Net Cash from Investing Activities | ($22,000) |
| Financing Activities | |
| Loan Payments | ($8,000) |
| Net Cash from Financing Activities | ($8,000) |
| Net Increase in Cash | $35,000 |
| Beginning Cash | $210,000 |
| Ending Cash | $245,000 |
Example for educational purposes only.
What Should You Look for on Your Cash Flow Statement?
The first question is straightforward:
Is the business generating positive cash flow from normal operations?
Then dig deeper.
Ask:
- Where is our cash coming from?
- Where is it going?
- Are operations generating enough cash to support the business?
- Are we relying heavily on loans?
- Are equipment purchases consuming cash?
- Do we have enough cash for upcoming payroll, taxes, rent, and other obligations?
A profitable company can still run into serious trouble if it consistently runs short of cash.

4. Accounts Receivable Aging Report
You made the sale.
You sent the invoice.
You recorded the revenue.
But did you actually get paid?
The Accounts Receivable Aging Report shows how much customers owe your business and how long those invoices have remained outstanding.
Example Accounts Receivable Aging Report
As of July 31
| Customer | Current | 0–30 Days | 31–60 Days | 61–90 Days | Over 90 | Total |
| ABC Company | $8,500 | $2,500 | $1,000 | $0 | $0 | $12,000 |
| DEF Services | $5,000 | $3,200 | $0 | $0 | $0 | $8,200 |
| GHI Enterprises | $12,300 | $4,500 | $1,500 | $500 | $0 | $18,800 |
| JKL Industries | $3,800 | $2,000 | $1,200 | $1,000 | $300 | $8,300 |
| MNO Solutions | $7,200 | $1,800 | $0 | $0 | $0 | $9,000 |
| Total | $36,800 | $14,000 | $3,700 | $1,500 | $300 | $56,300 |
Example for educational purposes only.
What Should You Look for on an Aging Report?
The older an unpaid invoice becomes, the more attention it deserves.
Look at the aging categories:
Current
Generally where you want most receivables.
0–30 Days Past Due
Worth monitoring.
31–60 Days
Time for increased attention.
61–90 Days
A potentially significant collection concern.
90+ Days
Requires serious attention.
The exact interpretation depends on your payment terms and industry, but the trend matters.
Watch for Customers Who Consistently Pay Late
One slow invoice may not mean much.
A customer who consistently stretches payment terms can create a cash-flow problem even if they’re one of your largest customers.
You may discover that a client generating significant revenue isn’t nearly as valuable as you thought once you consider how slowly they pay.

5. Budget vs. Actual Report
Your financial reports shouldn’t only tell you where you’ve been.
They should help determine whether you’re getting where you planned to go.
A Budget vs. Actual Report, sometimes called a variance report, compares what you expected to happen with what actually happened.
Example Budget vs. Actual Report
Year to Date
| Category | Budget | Actual | Variance | Variance % |
| Revenue | $1,700,000 | $1,715,000 | +$15,000 | +0.9% |
| Cost of Goods Sold | $610,000 | $609,000 | +$1,000 | +0.2% |
| Gross Profit | $1,090,000 | $1,106,000 | +$16,000 | +1.5% |
| Operating Expenses | $420,000 | $405,100 | +$14,900 | +3.5% |
| Net Profit | $670,000 | $700,900 | +$30,900 | +4.6% |
Example for educational purposes only.
What Should You Look for in a Budget vs. Actual Report?
Look for meaningful variances.
If revenue was supposed to be $500,000 but came in at $350,000, you need to understand why.
If payroll is 20% higher than expected, investigate.
If marketing is significantly over budget but sales are also outperforming expectations, that may be perfectly acceptable.
A variance isn’t automatically good or bad.
It is a signal to ask a question.

Don’t Review Financial Reports in Isolation
These five reports become much more powerful when reviewed together.
Imagine your P&L shows:
Revenue is up 15%.
Great.
Then your aging report shows:
Accounts receivable is up 40%.
Now we have a different conversation.
Sales increased, but customers aren’t paying as quickly.
Then the Cash Flow Statement shows declining operating cash.
Suddenly, the picture becomes clear.
The business isn’t necessarily suffering from a sales problem.
It may have a collections problem.
That’s why relying on a single financial number can be misleading.

Look at Trends, Not Just Individual Numbers
One month’s financial statement is useful.
Twelve months of financial statements are much more valuable.
Trend analysis can reveal changes that are difficult to see otherwise.
Consider tracking:
- Revenue
- Gross profit
- Gross margin
- Payroll
- Operating expenses
- Net profit
- Cash balance
- Accounts receivable
- Accounts payable
- Debt
Plotting these numbers month by month can help you recognize patterns before they become major problems.

Turn Your Monthly Financial Review Into a Habit
Set aside time every month to review your numbers.
It doesn’t need to become an all-day accounting meeting.
Start with these five reports:
- Profit & Loss
Are we profitable?
- Balance Sheet
Are we financially healthy?
- Cash Flow Statement
Are we generating enough cash?
- Accounts Receivable Aging
Are customers paying us?
- Budget vs. Actual
Are we performing according to plan?
Then identify the two or three numbers that deserve your attention before the next review.

Your CPA Should Help You Understand the Numbers
Financial reports aren’t particularly useful if they’re delivered to you without context.
A good accounting relationship should help business owners understand what the numbers mean and, more importantly, what questions those numbers should cause them to ask.
Maybe margins are shrinking.
Maybe cash is accumulating.
Maybe receivables are getting older.
Maybe debt is decreasing faster than expected.
Maybe you’re significantly outperforming your budget.
The financial statements provide the information.
Understanding that information helps you make better decisions.

Financial Reporting and Business Advisory Services From Lucia & Co. CPAs
At Lucia & Co. CPAs, we help businesses go beyond simply preparing financial statements and tax returns.
We help business owners understand their financial position so they can make more informed decisions about profitability, cash flow, taxes, growth, and the future of the company.
If you receive financial reports every month but rarely use them to make decisions, that’s an opportunity to get more value from your accounting.
Conclusion
You don’t need to memorize every line on your financial statements.
You don’t need to become a CPA.
But you should know enough about your company’s financial reports to recognize when something deserves your attention.
Start with five:
Profit & Loss.
Balance Sheet.
Cash Flow.
Accounts Receivable Aging.
Budget vs. Actual.
Review them consistently.
Compare them over time.
Ask questions.
Because good financial reporting isn’t just about documenting what happened.
It’s about giving you better information to decide what happens next.

Frequently Asked Questions
1. What financial reports should a business owner review each month?
A useful starting point is the Profit & Loss Statement, Balance Sheet, Cash Flow Statement, Accounts Receivable Aging Report, and Budget vs. Actual Report.
2. How often should I review my Profit & Loss Statement?
Many business owners benefit from reviewing it monthly, although some businesses may need more frequent financial monitoring.
3. What’s the difference between a P&L and an Income Statement?
They generally refer to the same financial statement showing revenue, expenses, and profit or loss over a particular period.
4. What does a Balance Sheet tell me?
It provides a snapshot of your company’s assets, liabilities, and equity at a particular point in time.
5. What’s the difference between a Balance Sheet and P&L?
A P&L covers activity over a period of time, while a Balance Sheet represents the company’s financial position at a specific date.
6. Why can my business be profitable but have no cash?
Revenue and expenses aren’t always recognized at the same time cash changes hands. Receivables, debt payments, inventory, equipment purchases, and other transactions can affect cash independently of accounting profit.
7. What is positive cash flow?
Generally, positive cash flow means more cash entered the business than left it during the measured period.
8. What is an Accounts Receivable Aging Report?
It organizes unpaid customer invoices according to how long they have been outstanding.
9. Why should I care about invoices over 90 days old?
Older receivables can indicate collection problems and tie up cash your business could otherwise use.
10. What is a Budget vs. Actual Report?
It compares expected financial performance with actual results.
11. What is a financial variance?
A variance is the difference between an expected or budgeted amount and the actual result.
12. Is being over budget always bad?
No. Context matters. An expense may exceed budget because the company generated significantly more revenue, made a strategic investment, or experienced an unexpected cost.
13. Should I compare financial statements to last year?
Yes. Year-over-year comparisons can help account for seasonal patterns and reveal longer-term trends.
14. What numbers should a business owner track every month?
The right KPIs vary by business, but revenue, gross profit, margin, operating expenses, net profit, cash, receivables, and debt are useful starting points.
15. Do small businesses need financial statements?
Financial statements can be valuable even for relatively small companies because they provide visibility into profitability, cash flow, debt, and overall financial health.
16. Can my accounting software create these reports?
Many accounting platforms can generate several of these reports, but the usefulness of the output depends heavily on accurate and properly categorized accounting data.
17. Why don’t my financial statements match my bank account?
Financial statements account for transactions differently from a bank balance. Outstanding checks, receivables, payables, financing, accrual accounting, and other factors can create differences.
18. Should my CPA review these reports with me?
That can be very helpful, particularly when you need assistance interpreting trends, planning taxes, evaluating financial decisions, or understanding unusual changes.
19. What’s the biggest mistake business owners make with financial reporting?
One common mistake is receiving reports but never using them to ask questions or make decisions.
20. How can Lucia & Co. CPAs help with financial reporting?
Lucia & Co. CPAs can help business owners maintain accurate financial information, understand their reports, identify important trends, and use financial data to support better business and tax-planning decisions.
